$ wget https://cf-courses-data.s3.us.cloud-object-storage.appdomain.cloud/IBM-BD0225EN-SkillsNetwork/labs/data/cars.csvInitialize Cluster
Monitoring & Debugging
Objectives
Here is what we’ll do in this example:
- Start a Spark Standalone Cluster and connect with the PySpark shell.
- Create a DataFrame and open the application web UI.
- Debug a runtime error by locating the failed task in the web UI.
- Run an SQL query to monitor, then scale up by adding another worker to the cluster.
Note I am running this on an IBM cloud platform, your use will vary as to how you start and access your UI.
Standalone Cluster
We will initialize a Spark Standalone Cluster with a Master and one Worker.
- We will start a PySpark shell that connects to the cluster and open the Spark Application Web UI to monitor it.
- We will be using the terminal to run commands and
- Docker-based containers to launch the Spark processe
Download Data
- Open a new terminal
- Download the data to the container
Stop Previous Containers
- Stop any previous running containers with
~$ for i in `docker ps | awk '{print $1}' | grep -v CONTAINER`; do docker kill $i;

done
Remove Previous Containers
- ignore any comments regarding: No such containers
~$ docker rm spark-master spark-worker-1 spark-worker-2

Error response from daemon: No such container: spark-master
Error response from daemon: No such container: spark-worker-1
Error response from daemon: No such container: spark-worker-2
Start Master Server
~$ docker run \
    --name spark-master \
    -h spark-master \
    -e ENABLE_INIT_DAEMON=false \
    -p 4040:4040 \
    -p 8080:8080 \
    -v `pwd`:/home/root \
    -d bde2020/spark-master:3.1.1-hadoop3.2
Start Spark Worker
~$ docker run \
    --name spark-worker-1 \
    --link spark-master:spark-master \
    -e ENABLE_INIT_DAEMON=false \
    -p 8081:8081 \
    -v `pwd`:/home/root \
    -d bde2020/spark-worker:3.1.1-hadoop3.2
Connect PySpark to Cluster
- Connect PySpark shell to the cluster and open the UI
- Launch PySpark shell in the running Spark Master container
~$ docker exec \
    -it `docker ps | grep spark-master | awk '{print $1}'` \
    /spark/bin/pyspark \
    --master spark://spark-master:7077

# Response
...
Setting default log level to "WARN".
To adjust logging level use sc.setLogLevel(newLevel). For SparkR, use setLogLevel(newLevel).
Welcome to
      ____              __
     / __/__  ___ _____/ /__
    _\ \/ _ \/ _ `/ __/  '_/
   /__ / .__/\_,_/_/ /_/\_\   version 3.1.1
      /_/

Using Python version 3.7.10 (default, Mar  2 2021 09:06:08)
Spark context Web UI available at http://spark-master:4040
Spark context available as 'sc' (master = spark://spark-master:7077, app id = app-20241104160301-0000).
SparkSession available as 'spark'.
Create DataFrame in the Shell
- Press ENTER twice to proceed after running the command in the shell
>>> df = spark.read.csv("/home/root/cars.csv", header=True, inferSchema=True) \
    .repartition(32) \
    .cache()
df.show()


+----+---------+------------+----------+------+------------+-----+------+--------------------+
| mpg|cylinders|displacement|horsepower|weight|acceleration|model|origin|            car_name|
+----+---------+------------+----------+------+------------+-----+------+--------------------+
|12.0|        8|       455.0|     225.0|4951.0|        11.0|   73|     1|buick electra 225...|
|27.0|        4|        97.0|     88.00|2100.0|        16.5|   72|     3|toyota corolla 16...|
|33.0|        4|       105.0|     74.00|2190.0|        14.2|   81|     2|    volkswagen jetta|
|21.0|        6|       200.0|         ?|2875.0|        17.0|   74|     1|       ford maverick|
|31.0|        4|       112.0|     85.00|2575.0|        16.2|   82|     1|pontiac j2000 se ...|
|36.0|        4|       105.0|     74.00|1980.0|        15.3|   82|     2| volkswagen rabbit l|
|25.5|        4|       140.0|     89.00|2755.0|        15.8|   77|     1| ford mustang ii 2+2|
|38.0|        6|       262.0|     85.00|3015.0|        17.0|   82|     1|oldsmobile cutlas...|
|13.0|        8|       318.0|     150.0|3940.0|        13.2|   76|     1|plymouth volare p...|
|18.0|        6|       258.0|     110.0|2962.0|        13.5|   71|     1|amc hornet sporta...|
|23.0|        4|        97.0|     54.00|2254.0|        23.5|   72|     2|   volkswagen type 3|
|20.0|        4|       130.0|     102.0|3150.0|        15.7|   76|     2|           volvo 245|
|19.4|        6|       232.0|     90.00|3210.0|        17.2|   78|     1|         amc concord|
|18.1|        6|       258.0|     120.0|3410.0|        15.1|   78|     1|     amc concord d/l|
|13.0|        8|       302.0|     130.0|3870.0|        15.0|   76|     1|           ford f108|
|26.0|        4|       156.0|     92.00|2585.0|        14.5|   82|     1|chrysler lebaron ...|
|23.0|        4|       115.0|     95.00|2694.0|        15.0|   75|     2|          audi 100ls|
|25.0|        4|       140.0|     92.00|2572.0|        14.9|   76|     1|            capri ii|
|20.0|        6|       232.0|     100.0|2914.0|        16.0|   75|     1|         amc gremlin|
|27.2|        4|       119.0|     97.00|2300.0|        14.7|   78|     3|          datsun 510|
+----+---------+------------+----------+------+------------+-----+------+--------------------+
only showing top 20 rows
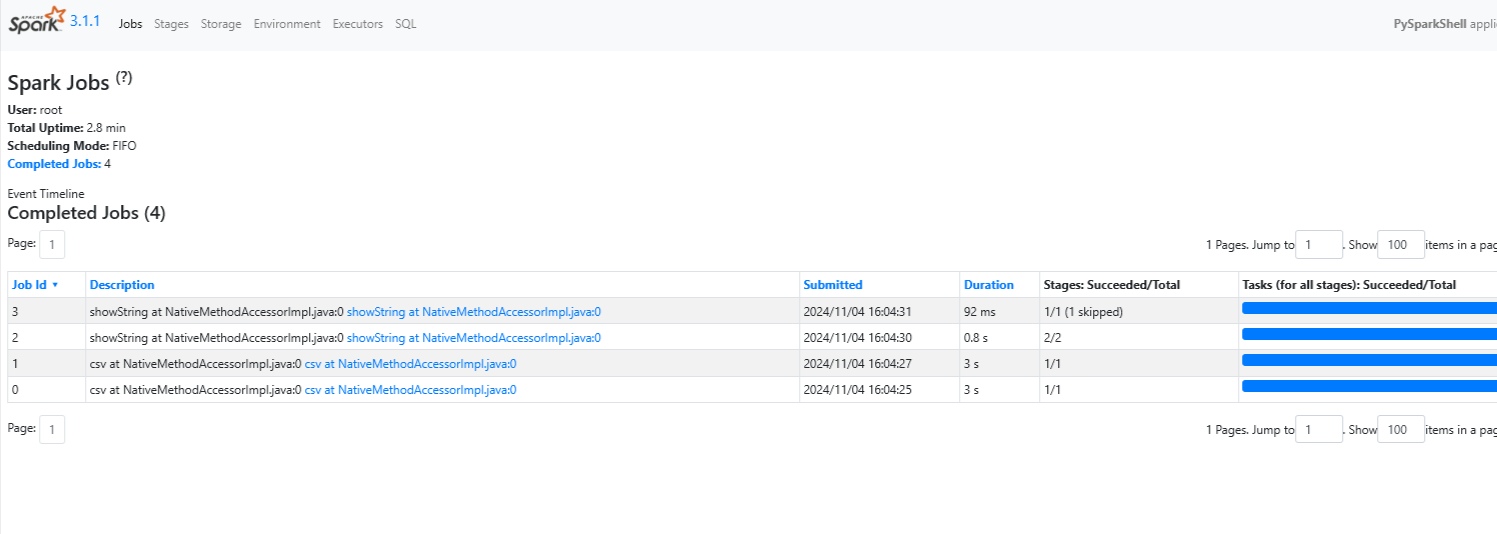
Launch UI
- Click on Network Toolbox (IBM specific only)
- Launch your application
- Enter port number: 4040
- Now we have the UI in a seperated tab
Run Query
- We will create a UDF
- Run a query that causes an error
- Locate the error and
- Find the root cause of the error
- Correct the error and
- Re-run the query
UDF
from pyspark.sql.functions import udf
import time

@udf("string")
def engine(cylinders):
    time.sleep(0.2)  # Intentionally delay task
    eng = {6: "V6", 8: "V8"}
    return eng[cylinders]
Add UDF as column
>>> df = df.withColumn("engine", engine("cylinders"))Group DF by cylinders
>>> dfg = df.groupby("cylinders")Aggregate other columns
>>> dfa = dfg.agg({"mpg": "avg", "engine": "first"})Show
>>> dfa.show()

...
  File "<stdin>", line 5, in engine
KeyError: 4

>>> 24/11/04 16:13:20 WARN TaskSetManager: Lost task 0.3 in stage 7.0 (TID 15) (172.17.0.3 executor 0): TaskKilled (Stage cancelled)
24/11/04 16:13:20 WARN TaskSetManager: Lost task 1.2 in stage 7.0 (TID 13) (172.17.0.3 executor 0): TaskKilled (Stage cancelled)
Failed
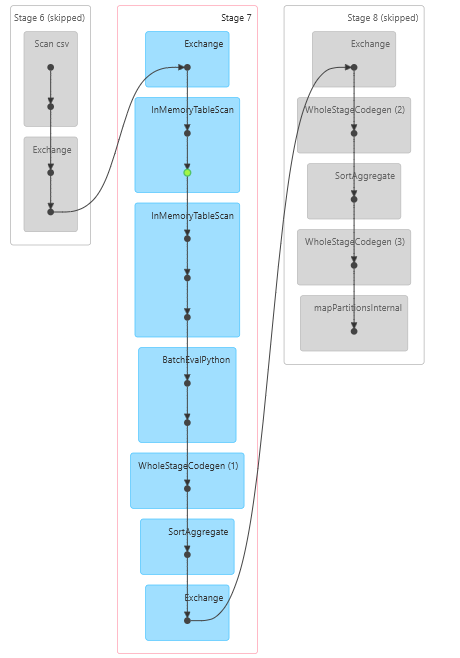
As you see above from the errors, the task failed
Debug Error
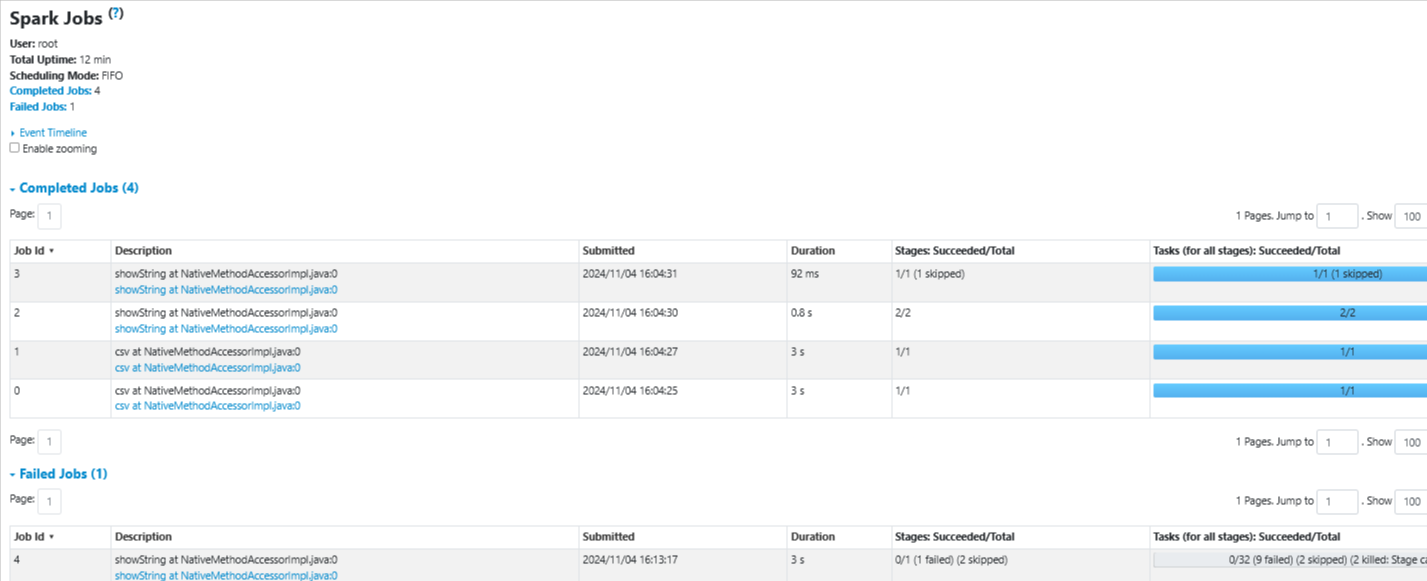
- From the UI, click on the Jobs Tab
- Find the Failed Jobs list down below
- Click on the first Job
Overview of Failed Job

Details of Failed Job

Failure Reason
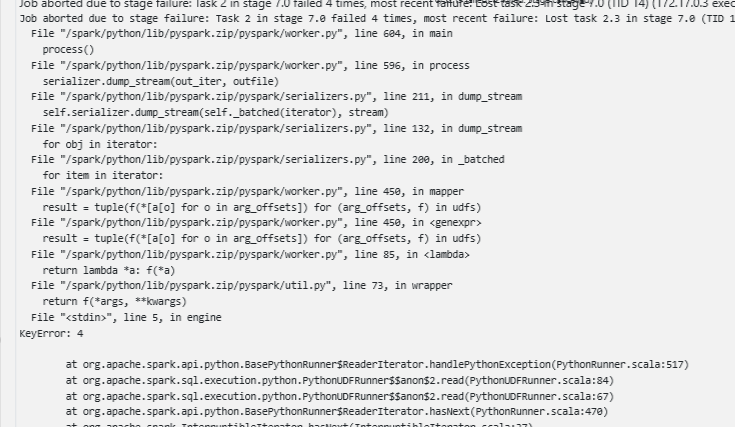
- If you scroll down in the Failure Reason column
- File <stdin>, line 5, in engine KeyError: 4…..
First thing I noticed is the fact that the data has 3 cylinder groups and we only specified 2 in the UDF
Correct UDF
>>> @udf("string")
def engine(cylinders):
    time.sleep(0.2)  # Intentionally delay task
    eng = {4: "inline-four", 6: "V6", 8: "V8"}
    return eng.get(cylinders, "other")
Re-Run Query
df = df.withColumn("engine", engine("cylinders"))
dfg = df.groupby("cylinders")
dfa = dfg.agg({"mpg": "avg", "engine": "first"})
dfa.show()


+---------+------------------+-------------+
|cylinders|          avg(mpg)|first(engine)|
+---------+------------------+-------------+
|        6|19.985714285714288|           V6|
|        3|             20.55|        other|
|        5|27.366666666666664|        other|
|        4|29.286764705882348|  inline-four|
|        8|14.963106796116506|           V8|
+---------+------------------+-------------+
Add Worker to Cluster
Now that we have run our query successfully, we will scale up our application by adding a worker to the cluster. This will allow the cluster to run more tasks in parallel and improve the overall performance.
Stages
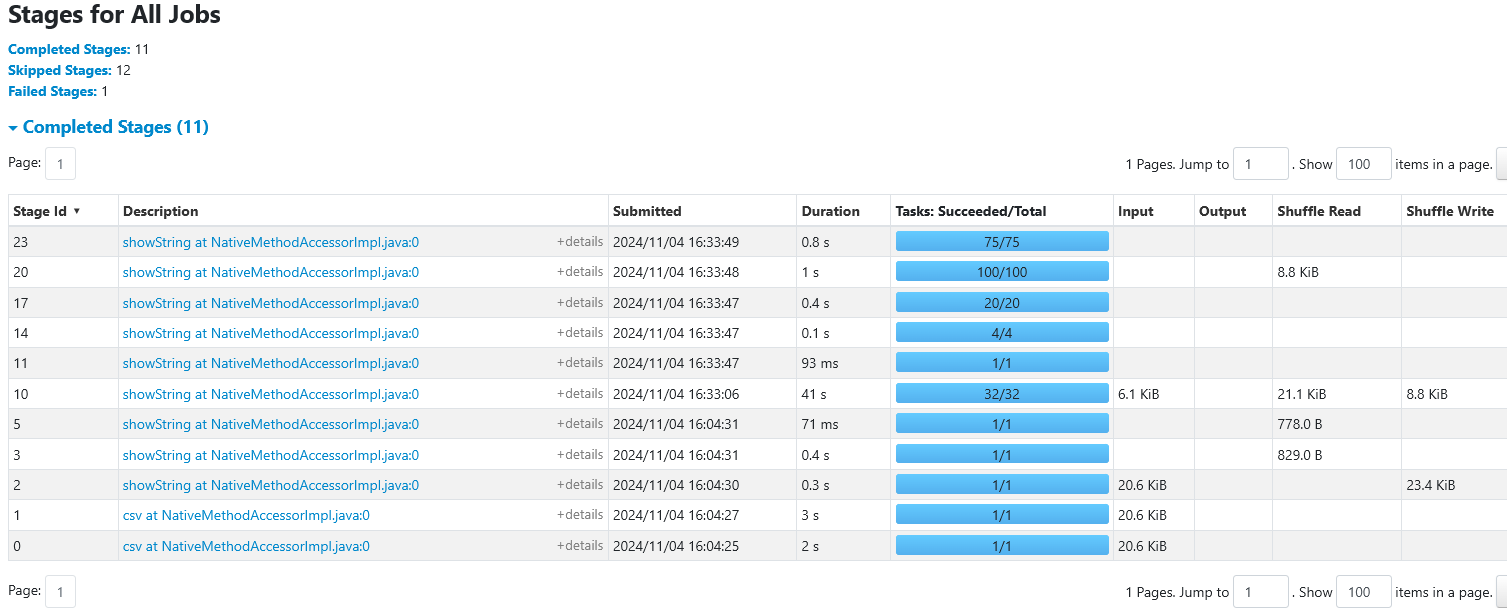
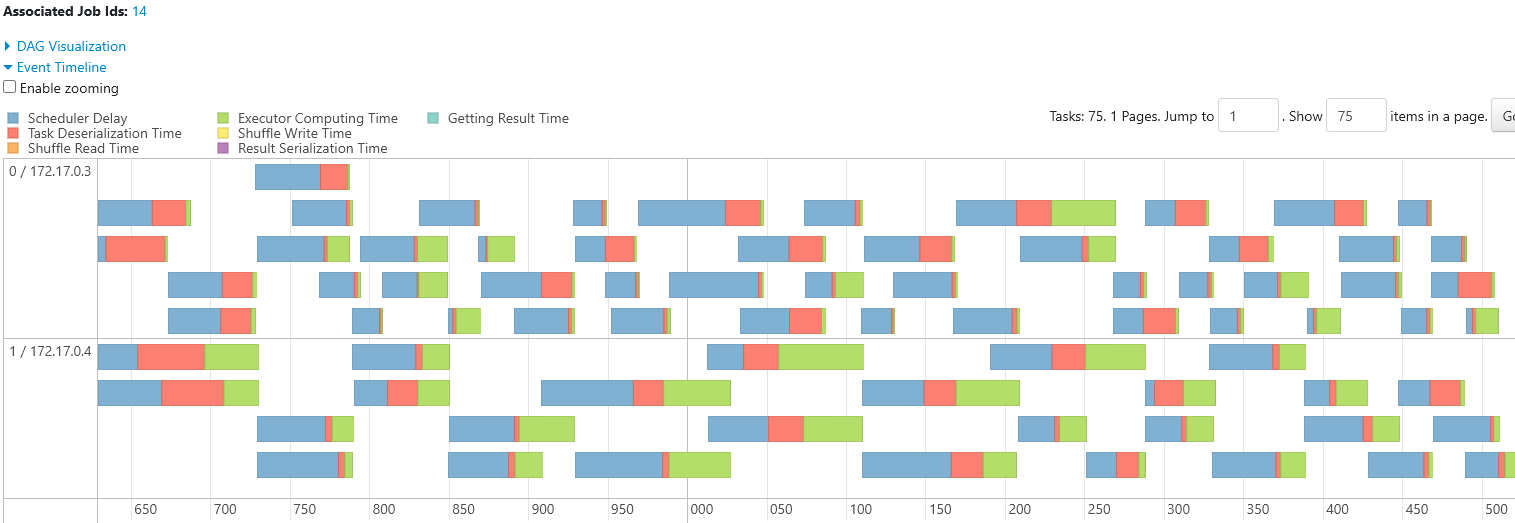
- Click on stage id 10 the stage with 32 tasks
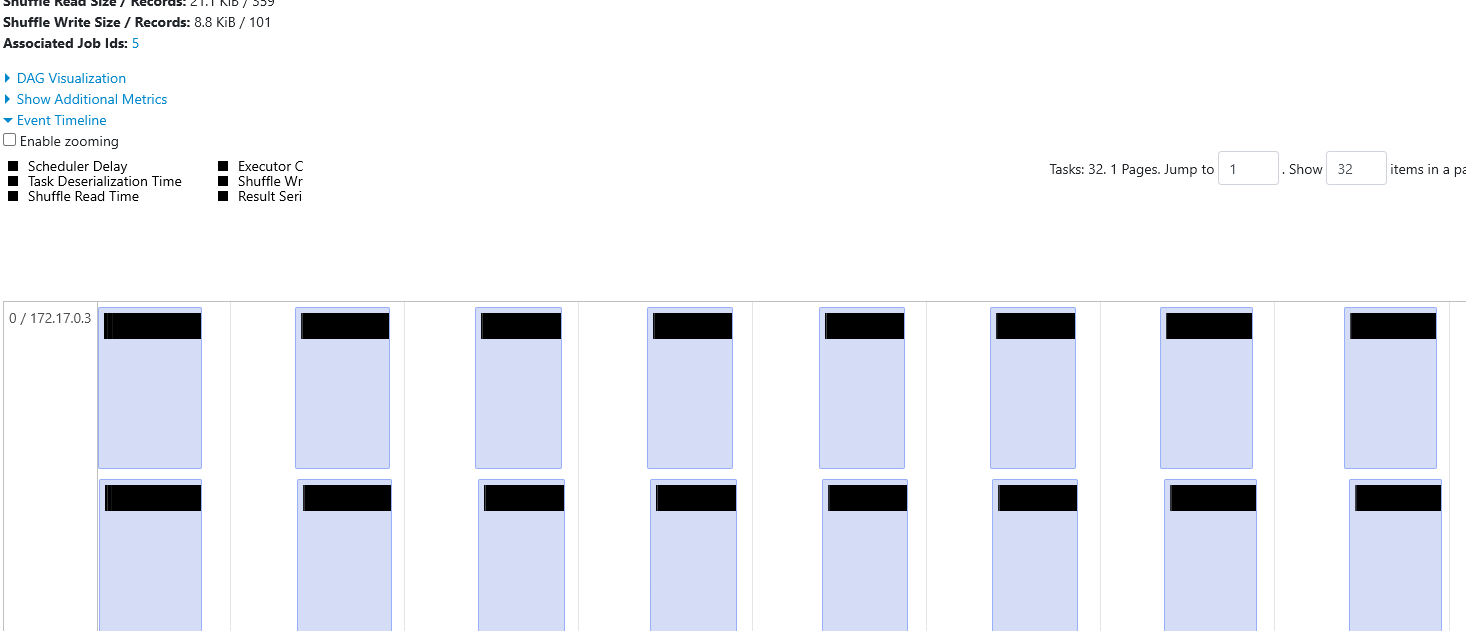
Timeline
- Looking at the timeline, you can see there is a single worker with id
0 / <ip-address>that can run up to a certain amount of tasks in parallel at one time. - If you count the boxes in the row (=32)
- Adding another worker will allow an additional tasks to be run in parallel.
Add Second worker
- New terminal
- Add second worker to the cluster
~$ docker run \
    --name spark-worker-2 \
    --link spark-master:spark-master \
    -e ENABLE_INIT_DAEMON=false \
    -p 8082:8082 \
    -d bde2020/spark-worker:3.1.1-hadoop3.2

# OUTPUT Container ID
c1c57e8d1298d64d0bf4f7b1cc0df7d6e0c25fbf6d2ab79b316ca4b0d36f9868
Go Back To Working Terminal
- Go back to the terminal with the Spark shell open
Re-Run Query with 2nd Worker
dfa.show()

+---------+------------------+-------------+
|cylinders|          avg(mpg)|first(engine)|
+---------+------------------+-------------+
|        6|19.985714285714284|           V6|
|        3|             20.55|        other|
|        5|27.366666666666664|        other|
|        4|29.286764705882348|  inline-four|
|        8|14.963106796116506|           V8|
+---------+------------------+-------------+
Launch UI
- Just as we did above relaunch the UI at port 4040
- Stages Tab
- Look at the latest Stage id row

- Click on the Description of Stage id=38 to view details
- You will see the additional worker with id 1/172.17.0.4
