# Read a Parquet file from disk
df = spark.read.parquet("users.parquet")

# Select certain columns and cache to memory
df = df.select("country","salary").cache()

# Group data by country and compute mean salary per country
mean_salaries = df.groupBy("country").agg({"salary":"mean"}).collect()Monitoring
Spark UI
Once you start your Spark application you’ll be able to access the UI at http://<driver-node>:4040
The UI shows information about the running application such as
- jobs
- stages
- tasks
- Storage of persisted RDDs and DataFrames
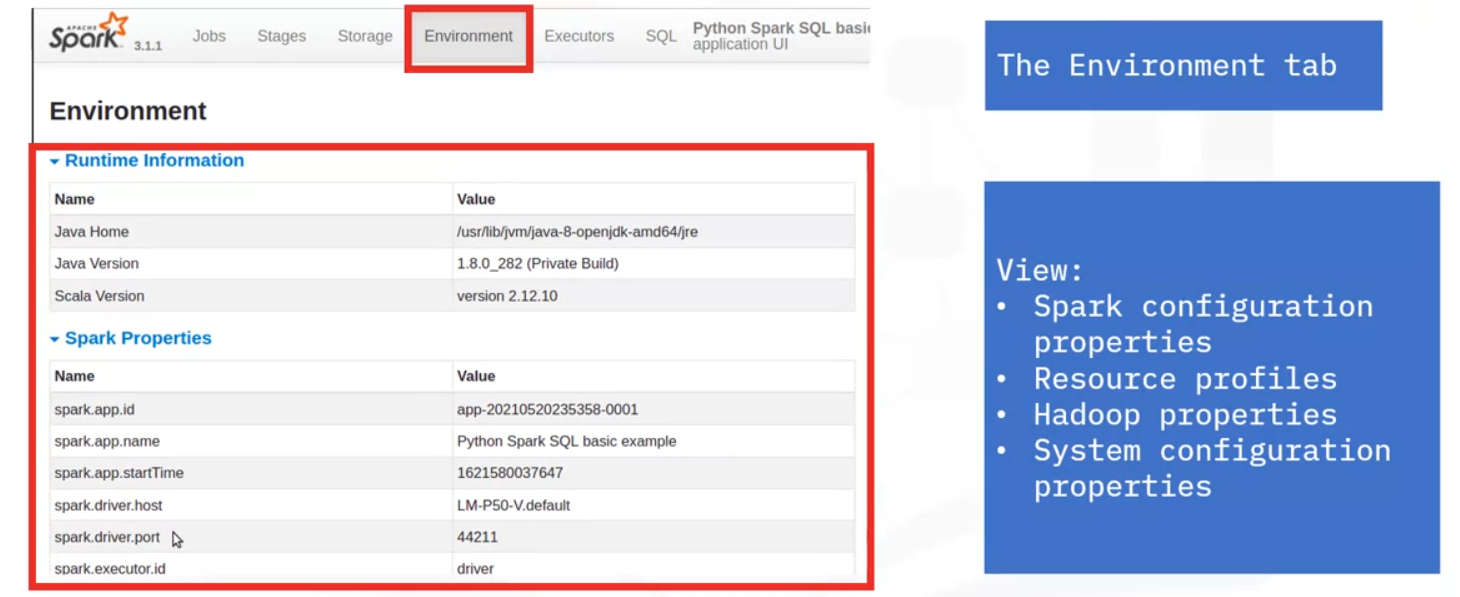
- Environment configuration and properties
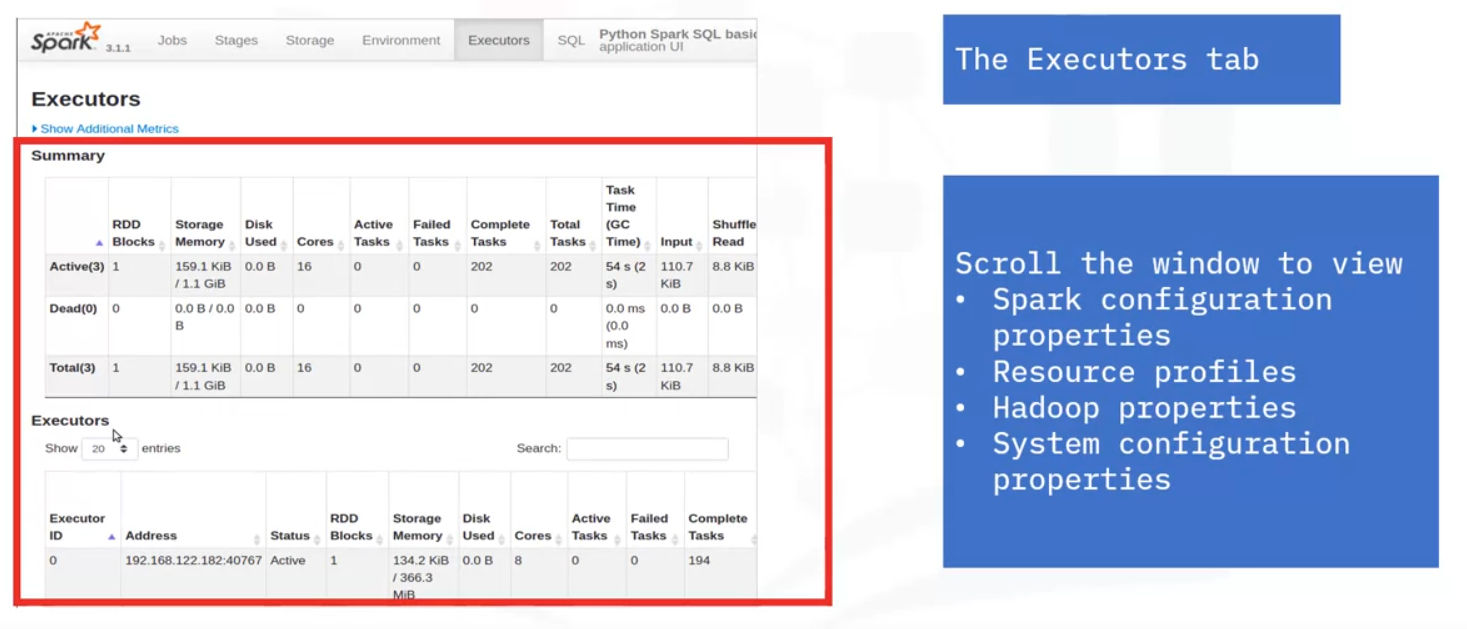
- Executor summary
- SQL information (if SQL queries exist)

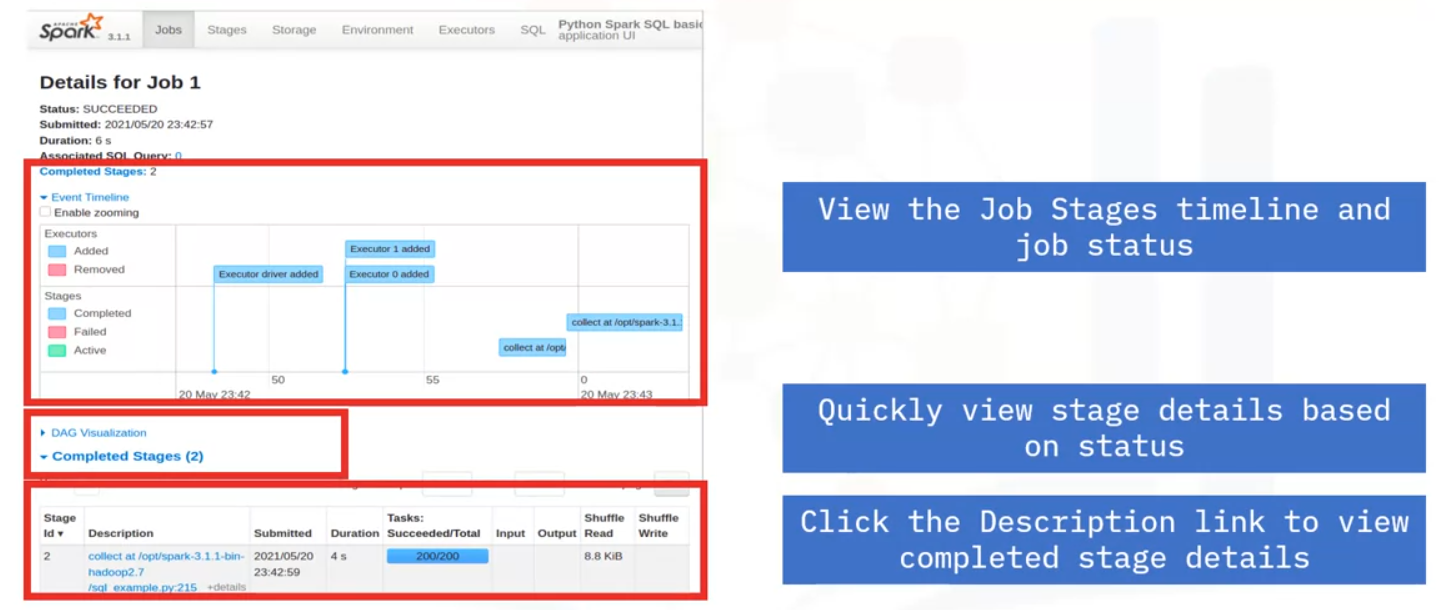
Job Details
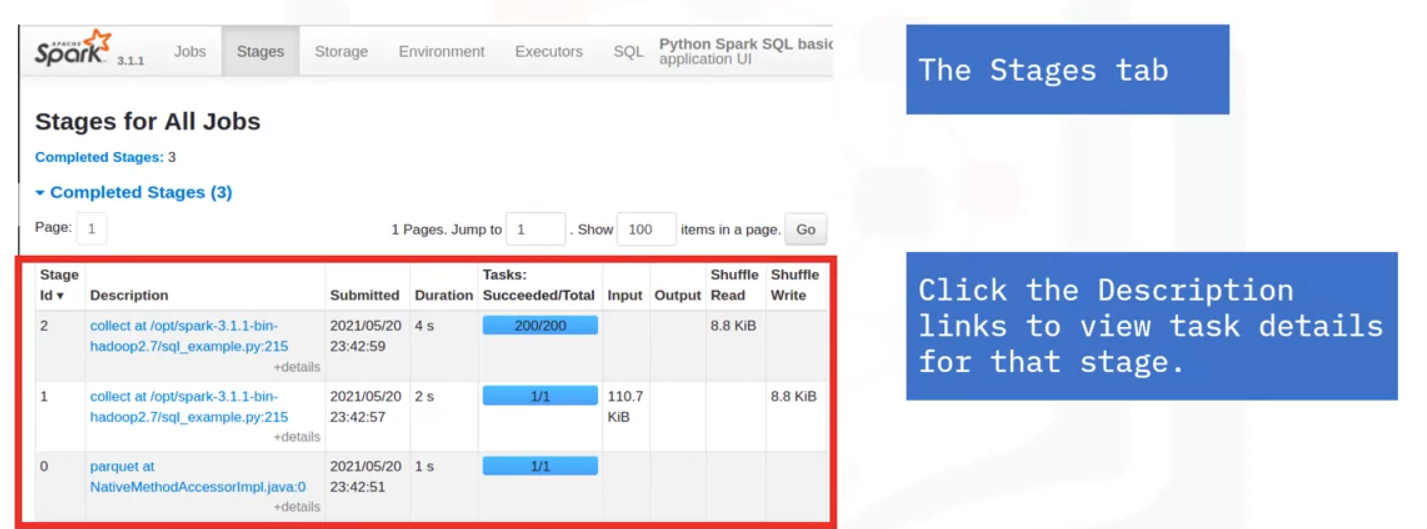
Stages
Storage

Environment
Executors
SQL
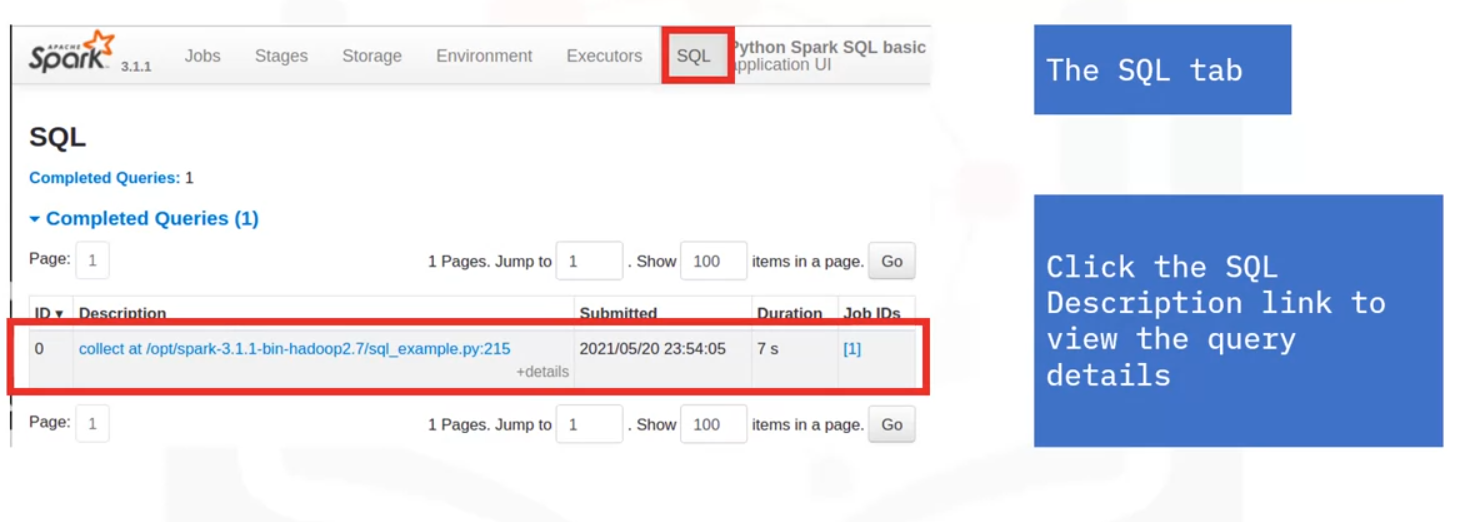
SQL Details Plan
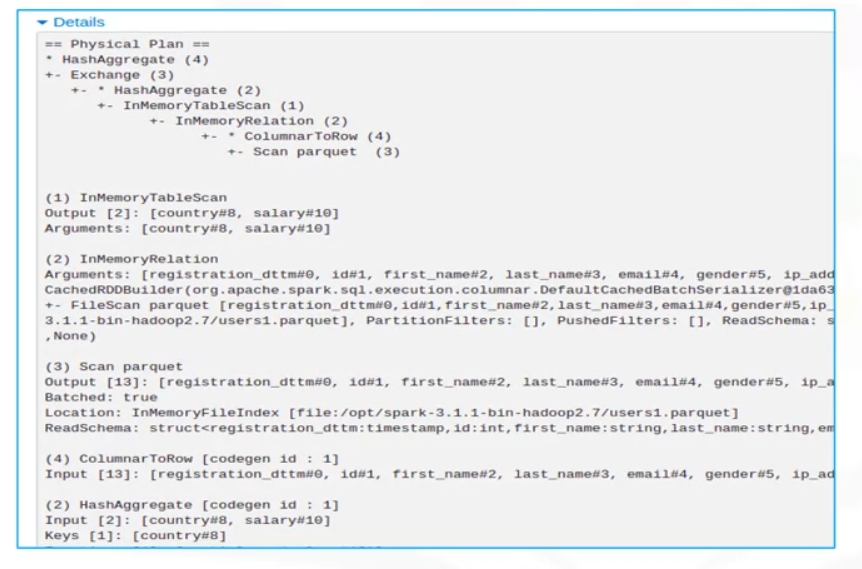
SQL DAG
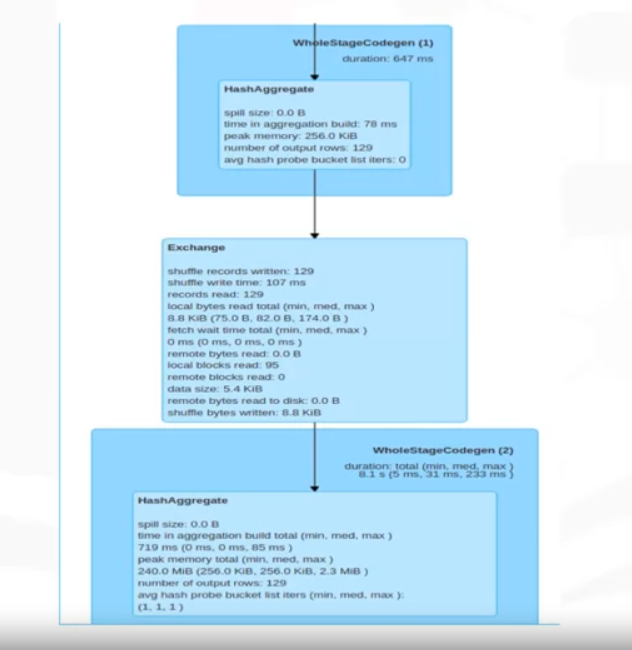
Monitoring
Monitoring jobs can quickly point to any failed processes, bottlenecks, or any other issues
Application flow
Let’s recap how the application flows:
- Jobs created by the SparkContext in the driver program
- Jobs in progress running as tasks in the executors
- Completed jobs transferring results back to the driver or writing to disk
Job Progress
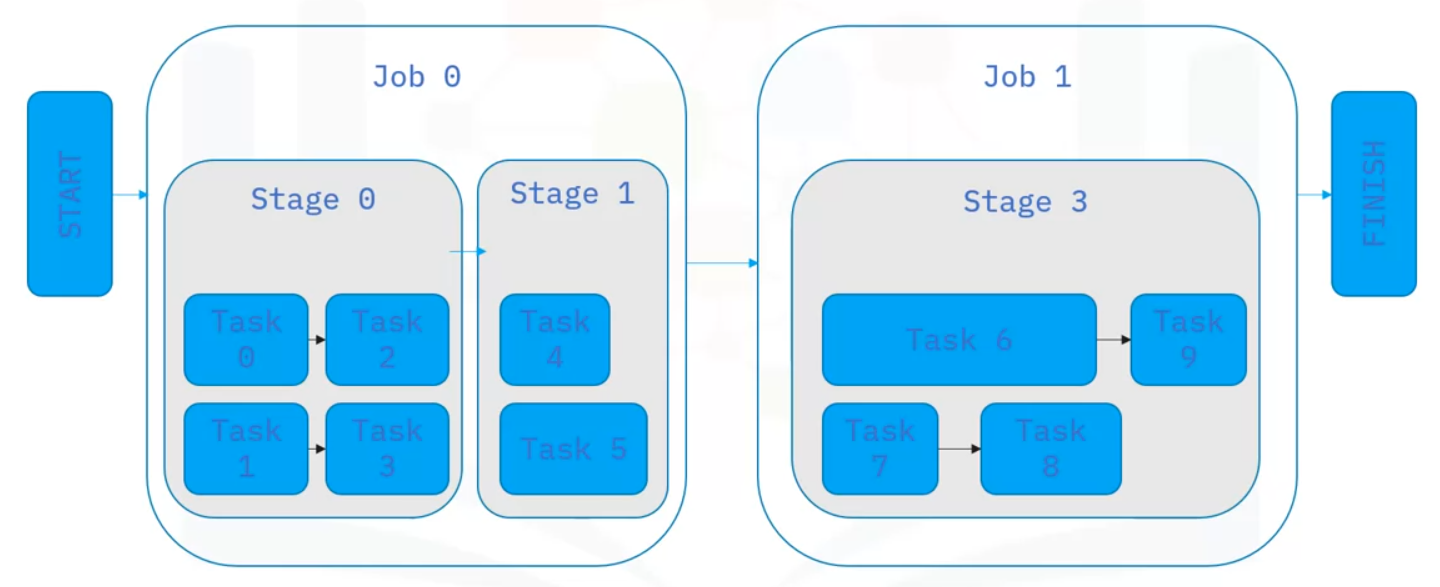
Let’s recap how jobs progress through Spark
- Spark jobs are divided into stages, which connect as a DAG (directed acyclic graph)
- Tasks for the current stage are scheduled on the cluster
- As the stage completes all its tasks, the next dependent stage in the DAG begins
- The job continues through the DAG until all stages complete
- If any tasks within a stage fail, after several attempts, Spark marks the task, stage, and job as failed and stops the application
Example - Monitoring
Let’s go through the steps the above code translates to a workflow you can monitor using the UI.
This application’s single data source is a Parquet file loaded from disk to produce a DataFrame.
Using that same DataFrame, two columns are selected.
The caching action is specific to this example.
The application groups the data by the “country” column and then aggregates the data by calculating the mean of the “salary” column.
Next the “collect” action runs. This action triggers the job creation and schedules the tasks, as the previous operations
are all lazily computed.
Monitor via UI
After you submit the application, start the Spark Application UI and view the Jobs tab, which displays two jobs.
- One job reads the Parquet file from disk.
- The second job is the result of the action to collect the grouped aggregate computations to send to the driver. (Remember groupBy requires shuffling therefore the second job)

- On the Jobs tab, click a specific job to display its Job Details page. Here you can see the number of stages and the DAG that links the stages.
- This example has two stages connected by a shuffle exchange, which is due to grouping the data by country in the application.
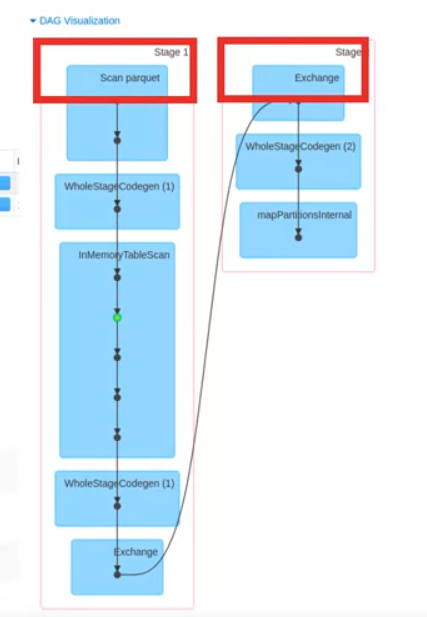
- Select a stage to view the tasks.

- The Stage Details timeline indicates each task’s state using color coding.
- View the timeline to see when each task was started and the task’s duration.
- Use this information to quickly locate failed tasks, see which tasks are taking a long time to run, and determine how well your application is parallelized.

- The task list provides even more metrics, including status, duration, and amount of data transferred as part of a shuffle.
- Here, you see two tasks that read one and two records as part of a shuffle. You see these two tasks because, by default for a shuffle, Spark repartitions the data into a larger number of partitions.
- You can also access a task’s executor logs.
- The data used in this example is small. Therefore, many tasks only have a small number of records to process.
When all application jobs are complete and the results are sent to the driver or written to disk, the SparkContext can be stopped either manually or automatically when the application exits.
History Event Logging
When the application UI server shuts down the UI is no longer available. To view the Application UI after the application stops, event logging must be enabled.
- This means that all events in the application workflow are logged to a file, and the UI can be viewed with the Spark History server.
- To view the Application UI with the History Server, first verify that event logging is enabled.
- Enter the event log path as seen using the properties displayed in the code chunk below before submitting the application.
- When the application completes, the Application UI populates the log files in the event log directory.
Enable
# This MUST be done BEFORE submitting the application
spark.eventLog.enabled true
spark.eventLog.dir <path-for-log-files>
View
- To start the history server, apply the command shown above.
- Once the history server is started, connect to the history server by typing the history server host URL followed by the default
port number 18080. - You can see a list of completed applications and select one to view its application UI.
# To view the application History once done, connect to History server with
http://<host-url>:18080
Common Application Errors
Common areas of Spark issues are in:
- User code
- Driver program: code that runs in the driver process: syntax, data validation, serialization, errors located in other code
- Serialized closures which contain the code’s necessary functions, classes, and variables
- The serialized closures are distributed into the cluster to run in parallel by the executors
- Configuration
- Application Dependencies
- Application files: source files such as Python script files, Java JAR files, required data files
- Application libraries
- Dependencies must be available for all nodes of the cluster
- Resource Allocation
- CPU and memory resources must be available for tasks to run
- Driver and executor processes require some amount of CPU and memory to run
- Any worker with free resources can start processes
- Resources are acquired until a process completes
- If resources are not available, Spark retries until a worker is free
- Lack of resources results in task time-outs, also called task starvation
- Network Communication
So what happens when task errors occur: they are reported to the driver program, and after several retries, the application will terminate
Log Files
- Application logs are found in
work/directory, named aswork/<application-id>/<stdout|error> - Spark Standalone writes master/worker logs to the
log/directory
Memory Resources
When running a Spark application, the driver and executor processes launch with an upper memory limit. The upper memory limit enables a Spark application to run without using all the available cluster memory, but this limit also requires that the memory limits are set high enough to perform necessary tasks.
- An application runs best when processes complete within the requested memory.
- If the driver and executor processes exceed the memory requirements, this situation can result in poor performance with data spilling to disk or even out-of-memory errors.
Executor Memory
- Executors use memory for processing and
- additional memory if caching is enabled.
- excessive caching can lead to out-of-memory errors.
Collecting data as a result of operations will be done in the driver.
Driver Memory
- Driver memory loads the data, broadcasts variables, and
- Handles results, such as collections.
- Because large data sets can easily exceed the driver’s memory capacity, if collecting to the driver, filter the data and use a subset of the data.
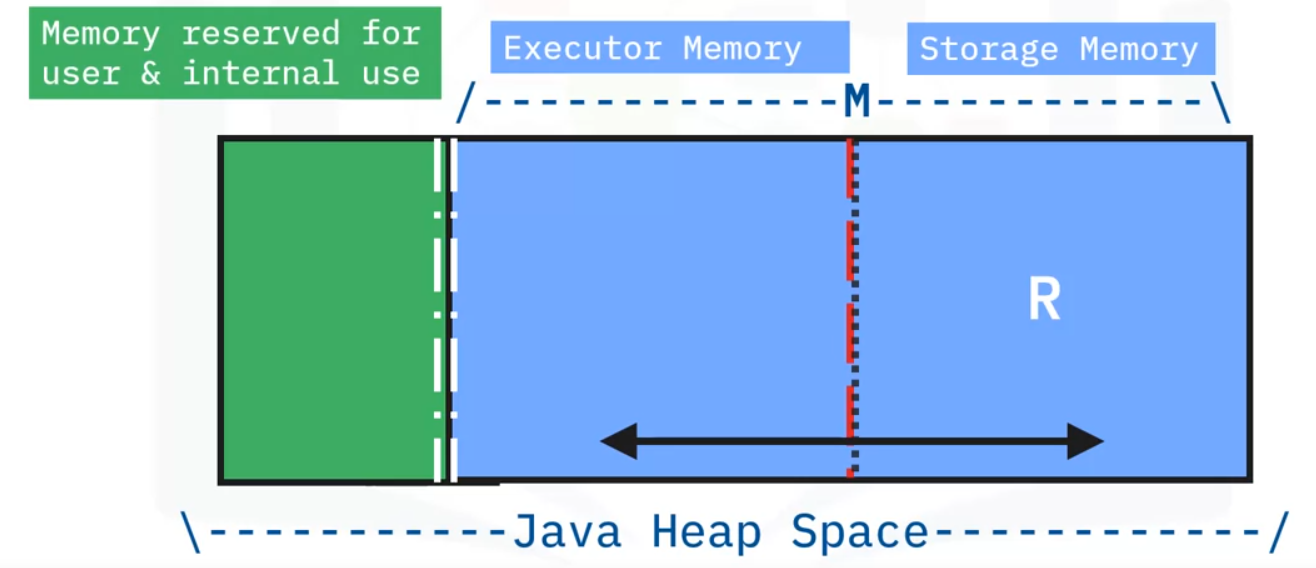
- In Spark, executor memory and storage memory share a unified regions shown in this Java Heap Space in the space labeled M.
- When no executor memory is used, storage can acquire all the available memory and vice versa.
- Executor memory can evict storage memory if necessary, but only until total storage memory usage falls under a certain threshold. In other words, R describes a subregion within M where cached blocks are never evicted.
- Storage is not allowed to evict executor memory due to complexities in implementation.
- This design ensures several preferable properties.
- First, applications that do not use caching can use the entire space for executor memory, obviating unnecessary disk spills.
- Second, applications that do use caching can reserve a minimum storage space, the area labeled R, where their data blocks are immune to being evicted.
- Lastly, this approach provides reasonable out-of-the-box performance for a variety of workloads without requiring user expertise of how memory is divided internally.
Data Persistence
Data persistence, or caching data, in Spark means being able to store intermediate calculations for reuse.
- By setting persistence in either or both memory and disk. After the intermediate data is calculated to produce a new DataFrame, and if memory is cached, then
- any other operations on that DataFrame can reuse the same data, rather than re-loading data from the source and re-calculating all prior operations.
- This capability is essential to speed machine learning workloads that often require many iterations over the same data set when training a model.
Setting Memory
There are several ways to set the memory for executors in a cluster, such as setting a value in the properties file. However, the more common practice is to specify a memory configuration when submitting the application to the cluster.
Executor memory
- You can tailor memory so that each application has enough memory to run effectively but does not use all available memory in the executor.
- This example configures the application to run on a Spark standalone cluster and reserves ten gibibytes per executor when running tasks.
- Here below we also set the number of executor cores for a Spark standalone cluster per executor process
$ ./bin/spark-submit \
        --class org.apache.spark.examples.SparkPi \
        --master spark://<spark-master-URL>:7077 \
        --executor-memory 10G \
        --executor-cores 8 \
        /path/to/examples.jar \
1000- We can also specify the executor cores for a Spark standalone cluster for the application
$ ./bin/spark-submit \
        --class org.apache.spark.examples.SparkPi \
        --master spark://<spark-master-URL>:7077 \
        --executor-memory 10G \
        --total-executor-cores 50 \
        /path/to/examples.jar \
        1000
Worker memory
If using the Spark Standalone cluster to manage and start a worker manually, you can specify the total memory and CPU cores that the application can use.
- These specifications determine the resources available when workers start the executors.
- Avoid assigning more resources than are available on the physical machine.
- For instance, if the machine has a CPU with eight cores and the worker starts with 16 cores, too many threads might run simultaneously and cause performance degradation.
- You can tailor memory so that each application has enough memory to run effectively but does not use all available memory in the executor.
- The default configuration is to use all available memory minus 1gigabyte for all available cores.
$ ./bin/start-worker.sh \
        spark://<spark-master-URL> \
        --memory 10G --cores 8
Node resources
- By default, Spark uses all available memory minus 1GB and all available cores
- We can set node memory resources with Max 10GB memory, 8 cores with same code as just above
$ ./bin/start-worker.sh \
        spark://<spark-master-URL> \
        --memory 10G --cores 8